ImpactOS Management Framework
Founder Health, Impact & Scale Framework A lifecycle-aware, founder-centric system for managing startup health, financial discipline, verified impact, and personal capacity. Decision-Support System • Not a Pitch Deck Core Principles Efficiency First No growth without efficiency. Verified Impact No impact without proof. Resource Triangle No proof without time, cash, and founder health. Data-Driven Decisions are
Founder Health, Impact & Scale Framework
A lifecycle-aware, founder-centric system for managing startup health, financial discipline, verified impact, and personal capacity.
Decision-Support System • Not a Pitch Deck
Core Principles
Efficiency First
No growth without efficiency.
Verified Impact
No impact without proof.
Resource Triangle
No proof without time, cash, and founder health.
Data-Driven
Decisions are data-driven and context-aware.
Founder Well-being
Central to sustainable scaling. If your team burns cash faster than growth, impact is unsustainable.
1. Phase States & The Journey
The “Phase Confidence Score” (PCS)
Think of this as your “Readiness Check.” Just because you can raise money doesn’t mean you are ready to scale.
PCS 50%: You have data, but many assumptions. (Caution)
PCS 90%: Your data proves you are ready. (Go fast)
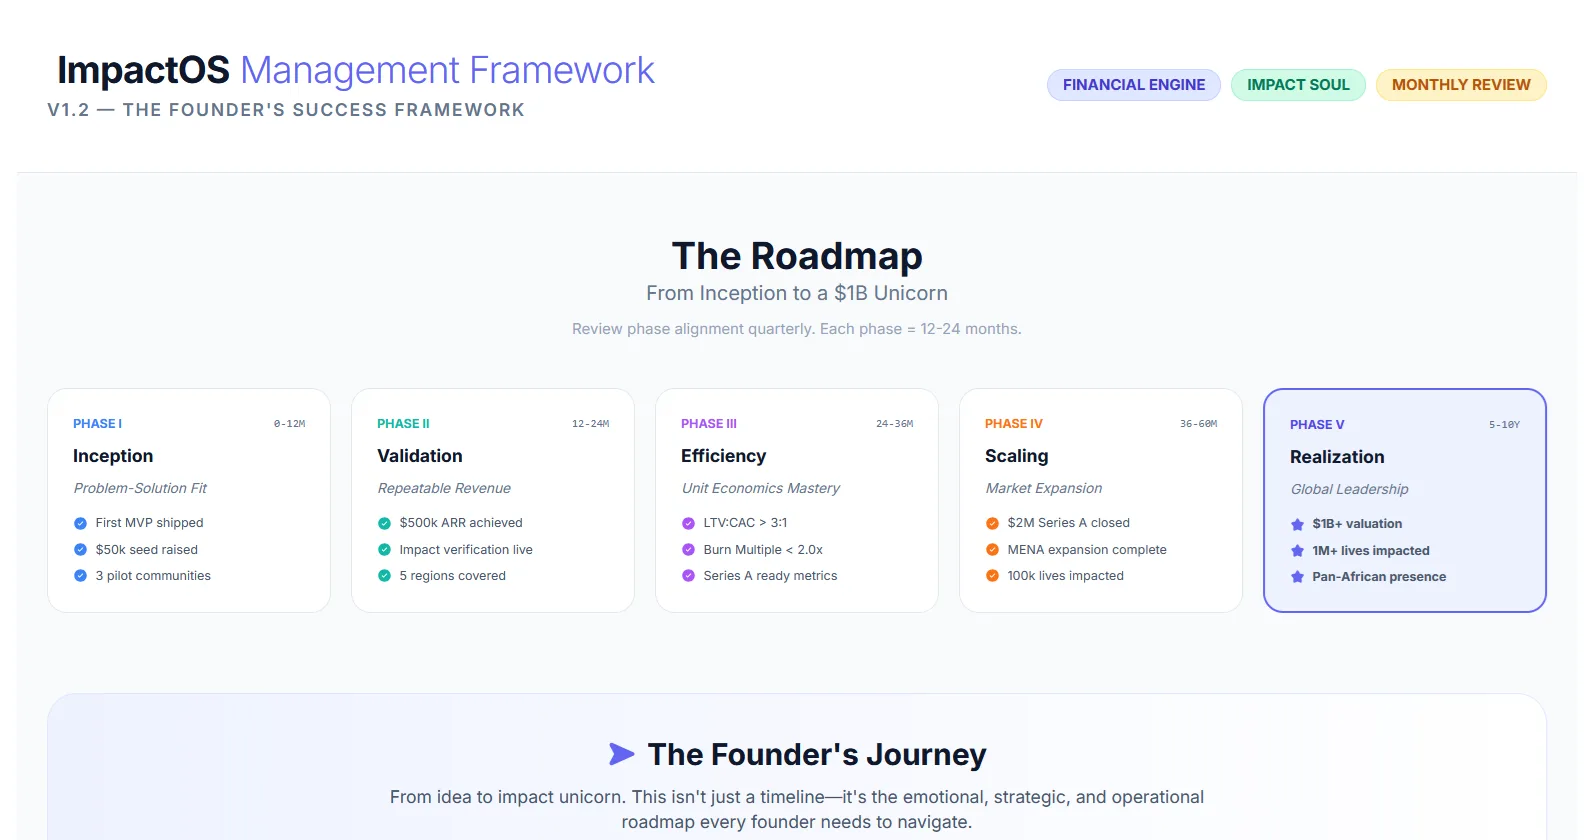
0–12 Months
Phase I: Inception
The Problem-Solution Dance
“Get out of the building. Talk to 100 humans before writing a single line of code.”
Focus Areas
- Customer Discovery: Find 50 people with the problem. Do they care?
- MVP: Build the ugliest, simplest version that solves the core issue.
- First Champions: Find 3–5 customers who love your vision.
- Impact Definition: Decide what you are measuring (e.g., “1 tree planted”).
⚠️ Top 5 Risks
- Building in Isolation (The “Lab Rat” trap).
- Cash Burn Misalignment (Spending on ads before product exists).
- Team Fragility (Co-founder disputes).
- Market Misreading (Solving a problem that doesn’t exist).
- Impact Washing (Claiming you save the world with zero proof).
Success Looks Like:
You found 3 customers with a burning pain point, built a prototype in 90 days, and defined your impact unit.
12–24 Months
Phase II: Validation
From Love to Revenue
“Love is nice, but revenue is proof. Prove you can make $1 consistently before trying to make $1M.”
Focus Areas
- Pricing: Find the price point where customers buy without hesitation.
- Sales Playbook: Write down how you sell so you can hire someone else.
- Impact Proof (Internal): Use internal data as Proxy for impact.
- Core Team: Hire first non-founder managers.
⚠️ Top 5 Risks
- Premature Scaling (Hiring sales reps before you know how to sell).
- Feature Creep (Adding buttons instead of fixing the core).
- Burn Rate Acceleration.
- Founder-CEO Transition (Struggling to delegate).
- Impact-Revenue Gap (Making money but losing mission).
Success Looks Like:
10–20 paying customers, steady revenue, and internal data confirms impact.
24–36 Months
Phase III: Efficiency
Mastering the Money Machine
“Efficiency isn’t about being cheap—it’s about flow. No leaky buckets.”
Focus Areas
- Metric Mastery: LTV:CAC (SaaS) or Cash Cycles (Marketplace).
- SOPs: “Standard Operating Procedures.” Write manuals.
- Data Dashboard: Automate your reports.
⚠️ Top 5 Risks
- Growth Plateau.
- Culture Dilution.
- Burn Multiple Spiral.
- Impact Dilution.
- Competitor Response.
Success Looks Like:
Margins healthy, cash flow positive (or trending), team works without you.
36–60 Months
Phase IV: Scaling
Market Domination
“Scaling isn’t just doing more—it’s building a machine that runs without me.”
Focus Areas
- Expansion: New countries or product lines.
- Executive Team: Hiring VP-level leaders.
- Verified Impact: Mandatory Third-Party Audit.
- Brand: Becoming the “Category King”.
⚠️ Top 5 Risks
- Cultural Missteps (Failing in new country).
- Cash Flow Mismatch.
- Execution Debt.
- Founder Burnout.
- Impact Verification Gap.
Success Looks Like:
3+ regions, impact certified, 18+ months runway.
5–10 Years
Phase V: Realization
The Legacy
“Legacy isn’t what you build for yourself—it’s what you leave for the next generation.”
Focus Areas
- Pan-Regional Power: Presence across the region.
- Policy Shaping: Working with governments.
- Ecosystem Building: Investing in next wave.
- Succession: Planning the exit.
⚠️ Top 5 Risks
- Innovator’s Dilemma.
- Bureaucracy Creep.
- Mission Drift.
- Founder Identity Crisis.
- Global Competition.
Success Looks Like:
Verify >95% impact, company grows even if you take a 6-month vacation.
Golden Rules for Every Phase
Cash is Oxygen:
Know your runway; never < 6 mo.
Team > Idea:
Great teams outperform mediocre ideas.
Impact = Revenue:
Must grow proportionally.
One Metric:
Focus obsessively on the phase key metric.
Decision Velocity:
Fast decisions beat perfect decisions.
Founder Health:
Most important asset. Protect it.
STOP: Calibrate Before You Measure
Do not use this framework without declaring your “Type” first.
Standard SaaS
Asset/Infra Heavy
Ops-Heavy / Marketplace
GovTech / Regulated
Deep Impact
Part 1: The Financial Engine
1. Cash Runway
Months until cash = 0
Patch: Standard 12-18mo.
Infra: Calc Liquid Runway separately from CAPEX.
2. Revenue Velocity
Speed/Consistency of Revenue
Patch: Standard: MoM growth.
GovTech: Measure “Contract Value Added” quarterly.
3. Burn Multiple
Net Burn ÷ Net New Revenue
Patch: Target <1.5x.
Infra: Exclude CAPEX assets from Burn.
4. LTV:CAC
Lifetime Value ÷ Acq. Cost
Patch: Target >3:1.
Commerce: Prioritize GMV Retention/Order Freq.
5. Gross Margin
Profit % per unit/service
Patch: SaaS: 60-80%.
Ops/Agri: 15-20% acceptable if volume high.
6. Net Revenue Retention (NRR)
Repeat + Expansion Revenue
Patch: Target >100%.
Critical for EdTech/SaaS survival.
7. Sales Cycle Length
Time to close a contract
Patch: Standard <90 Days.
GovTech: Green zone extends to 12 months.
8. Productivity per Employee
Revenue ÷ Full Time Employees
Patch: Target >$100k/yr.
Super-App: Only count HQ staff (not drivers).
9. Capital Efficiency
Revenue per $1M Raised
Gatekeeper: Cannot exit Phase II without >$1M ARR per $1M raised.
10. AR / AP Stress Ratio
Receivables Days ÷ Payable Days
Critical: AR must be < AP. Don't be a bank for your customers.
Part 2: The Impact Soul
11. Impact-to-Revenue
Alignment of Mission & Money
Rule: Revenue ↑ & Impact ↑ = Healthy.
If Revenue ↑ but Impact ↓ = Mission Drift.
12. Cost per Impact Unit
Efficiency of doing good
Patch: Early Stage: Use “Proxy Metrics” (volume) to save audit costs.
13. Geographic Reach
Active Regions/Cities
Check: In early phases, prioritize Depth (market share) over Breadth.
14. Impact Depth
Lives affected per $10k Invested
Patch: EdTech/Health: Use Leading Indicators (time-on-task) as proxy for outcomes.
15. SDG Coverage
UN SDGs addressed
Rule: Limit to 1–2 SDGs. Claiming 10+ is “Spray and Pray”.
16. Impact Verification Rate
% of impact independently verified
Target: 70% by Phase III.
Climate: Must be 100% Audited from Day 1.
17. ESG Premium
Valuation/Pricing Premium
Measure: Can you charge higher prices/raise cheaper capital due to impact?
18. Community Resilience
Ecosystem Lift
Metric: % spending on local suppliers vs imported consultants.
19. Gender Equity Ratio
% Women Beneficiaries
Target: >50%. Check Leadership/Board roles too, not just junior staff.
20. Impact-Revenue Correlation
Directional Alignment
Greenwash Detector: Plot Rev vs Impact. Divergence = Immediate Review.
Part 3: Meta-Layer & Zones
Founder Health & Risks
- 21. Decision Latency (Thndr Protocol) Time from Signal → Decision. Founder stalling penalizes score. Regulatory stalling does not.
- 22. Power & Dependency Risk Check: Single client >40% revenue? Single Gov license? = “Red Zone”.
- 23. Founder Health Index Isolation >3 weeks since mentor talk = Danger. Recovery <2 days off in 90 days = Danger.
🟢 Green Zone
Runway >12mo, Burn improving, Founder healthy.
Action: Continue & Optimize.
🟡 Yellow Zone
Runway 6–12mo, Metrics plateauing.
Action: Monitor closely.
🔴 Red Zone
Runway <6mo, Burn worsening, Founder sick.
Action: IMMEDIATE intervention.
🔵 Blue Zone
Runway >24mo, Impact Audited, Latency <5 days.
Action: Scale with caution.
Founder Rules (Unbreakable)
1. No phase confidence without data
2. No growth without efficiency
3. No impact without verification
4. No metrics without context
5. No scale without founder health
8. Practical Examples
Example 1: B2B SaaS (Inception)
- Cash Runway 9 months (Yellow)
- MRR Trend +10% MoM (Green)
- Burn Multiple 1.5x (Healthy)
- Phase Confidence 65% (Caution)
- Founder Energy Moderate (Track)
Example 2: GovTech (Validation)
- Rev Velocity Slow but Signed (Green)
- Impact Verif. Internal Only (Yellow)
- Geo Reach 2 Governorates (Yellow)
- PCS Score 70% (Fragility Detected)
- Founder Health Stressed (Support Needed)
9. How to Use ImpactOS
Monthly Review
Track all KPIs and update dashboards.
Quarterly Assessment
Recalculate PCS, identify risks, decide interventions.
Visualize
Use simple traffic-light indicators.
Iterate
Adjust strategy before problems become critical.
Founder’s Dictionary
Financial Metrics
- MRR / ARR Monthly / Annual Recurring Revenue. The predictable “heartbeat” of subscription income.
- LTV : CAC Life Time Value vs Customer Acquisition Cost. Profit per customer vs cost to acquire them.
- Burn Multiple Net burn divided by net new ARR. Measures capital efficiency in growth.
- NRR (Net Revenue Retention) Starting MRR + Expansion – Churn, divided by Starting MRR. Measures existing customer health.
Impact Metrics
- Impact Unit Standardized measure of impact (tons CO₂ reduced, liters saved, lives improved).
- SDG Coverage The UN’s 17 Sustainable Development Goals—the global language for measuring impact.
- Verification Rate Percentage of impact claims verified by third-party audit. No proof = No impact.
- ESG Premium Additional valuation multiple or price premium attributable to strong ESG performance.
Tools & Measurement
Leading vs Lagging Indicators
Leading: Predict future performance (sales pipeline).
Lagging: Historical results (revenue).
Data Sources
ERP (financials), CRM (customers), Impact Dashboard
(impact metrics), HRIS (employee data).
ERP: Accounting
CRM: Customers
SHOP: Sales
Impact: Dashboard
HRIS: People
BI: Analytics
Metric Classification
Leading Indicators (Predict Future)
- Sales Pipeline Value: Predicts future revenue
- Customer Satisfaction (CSAT/NPS): Predicts retention
- Product Engagement: Predicts expansion & churn
- Team Happiness Score: Predicts productivity
Lagging Indicators (Measure Past)
- Revenue/ARR/MRR: Historical performance
- Profit Margins: Past efficiency
- Churn Rate: Historical customer loss
- Impact Units Delivered: Past impact achieved
Balance leading and lagging indicators for complete
picture. Review leading indicators weekly, lagging monthly.
ImpactOS Summary
ImpactOS equips founders to make honest decisions, balance growth with capacity, and detect hidden risks early.
It does not judge; it protects founders from self-deception.
© Founder Health & Scale Framework
How this article was made
- Newsroom
- GoingNext newsroom
- Sources
- No source cited for this piece.